Feature Importance
Contents
Feature Importance#
In brief#
The feature importance technique provides a score, representing the “importance”, for all the input features for a given AI model, i.e., a higher importance means that the corresponding feature will have a larger effect on the model.
More in detail#
Local explanations, especially when dealing with tabular data, can also be returned in the form of features importance. This technique considers both the sign and the magnitude of the contribution of the features for a given AI decision. In particular, if the value of a feature is positive, then it contributes by increasing the model’s output; at the same time, if the sign is negative, then the feature decreases the output of the model. At the same time, if a feature has a higher contribution than another, both positively and negatively, then it means that it has a stronger influence on the prediction of the black box outcome. The magnitude of the provided score expresses this meaning.
The features importance summarizes the outcome of the black box model, allowing quantifying the changes of the black box decision for each test record. This means it is possible to identify the features leading to a specific outcome for a certain instance and how much they contributed to the decision. In the following, we provide a couple of examples obtained with two of the most popular methods, namely lime and shap, both model-agnostic local explanation methods.
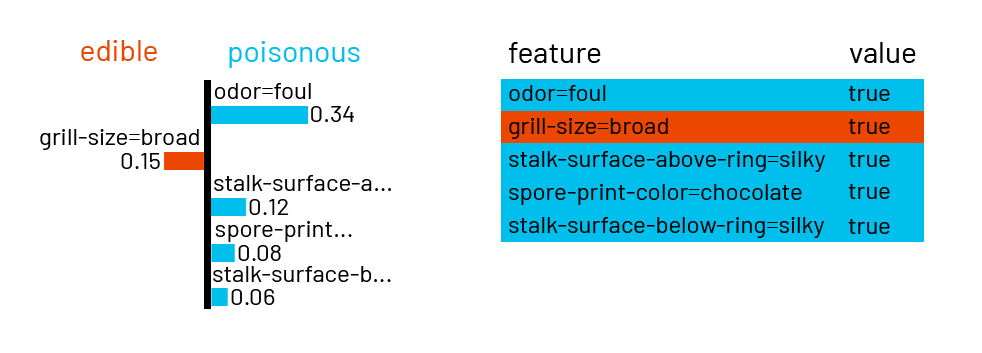
The lime explanation method [1] randomly generates synthetic instances around the analyzed record. Then it returns the features importance as the coefficient of a linear regression model adopted as a local surrogate. The synthetic instances are weighted according to their proximity to the instance of interest. The Lasso model is trained to approximate the probability of the decision of the black box in the synthetic neighborhood of the instance analyzed. Fig. 3 shows the features importance returned by lime in a scenario where we want to predict if a mushroom is edible or poisonous. Indeed, here the prediction class has only two classes, and we want to understand which features are most relevant to discriminate between the two classes. In this example, the feature odor=foul has a positive contribution of 0.26 in predicting of a mushroom as poisonous, stack-surface-above-ring=silky has a positive contribution of 0.11, spore-print-color=chocolate has a positive contribution of 0.08, stack-surface-below-ring=silky has a positive contribution of 0.06, while gill-size=broad has a negative contribution of 0.13.
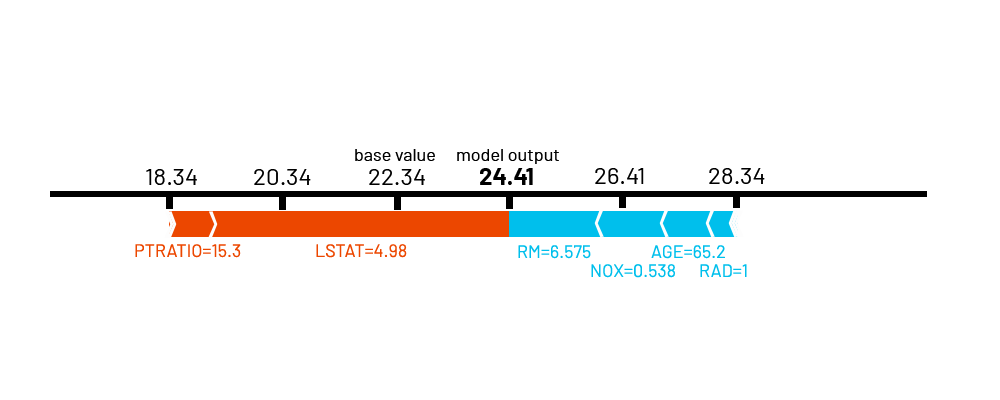
The shap explanation method [3] connects game theory with local explanations exploiting the Shapely values of a conditional expectation function of the black box to explain the AI. Shapley values are introduced in [4] with a method for assigning “payouts” to “players” depending on their contribution to the “total payout”. Players cooperate in a coalition and receive a certain “profit” from this cooperation. The connection with explainability is as follows. The “game” is the decision of the black box for a specific instance, while the “profit” is the actual value of the decision for this instance minus the average values for all instances. The “players” are the feature values of the instance that leads towards a certain value, i.e., collaborate to receive the profit. Thus, a Shapley value is the average marginal contribution of a feature value across all possible coalitions, i.e., combinations [5]. Therefore, shap returns the local unique additive feature importance for each specific record. The higher a Shapely value, the higher the contribution of the feature. Fig. 4 shows an example of shap explanation, where the features importance is expressed in the form of a force plot. The example is based on the Boston Housing Dataset1, a dataset that collects information relative to a portion of US census data (such as the age) along with some information about the areas (i.e., pupil-teacher ratio by town or accessibility to radial highways). This explanation each feature’s contribution levelin pushing the black box prediction from the base value (the average model output over the dataset, which is 24.41 in this example) to the model output. The features pushing the prediction higher are shown in light blue, and those pushing the prediction lower are shown in orange.
Even if the classic application case of feature importance is with tabular data, it is important to note that, under appropriate settings, lime and shap can also be used to explain the decisions of AI working on textual data and images.
Bibliography#
- 1
M.T. Ribeiro, S. Singh, and C. Guestrin. "why should I trust you?": explaining the predictions of any classifier. In SIGKDD. 2016.
- 2(1,2)
Riccardo Guidotti, Anna Monreale, Dino Pedreschi, and Fosca Giannotti. Principles of Explainable Artificial Intelligence. Springer International Publishing, 2021.
- 3
S. M. Lundberg and S.-I. Lee. A unified approach to interpreting model predictions. In Advances in neural information processing systems, 4765–4774. 2017.
- 4
Lloyd S Shapley. A value for n-person games. Contributions to the Theory of Games, 2(28):307–317, 1953.
- 5
Christoph Molnar. Interpretable Machine Learning. Lulu. com, 2020.
This entry was readapted from Guidotti, Monreale, Pedreschi, Giannotti. Principles of Explainable Artificial Intelligence. Springer International Publishing (2021) by Francesca Pratesi and Riccardo Guidotti.